
An optimistic scenario did not materialize for Bitcoin this weekend. On Sunday, a weekly high of $21,888 was registered; however, at the end of the day, momentum turned in a bearish direction. The current week started in the same order and now Bitcoin is clocking its 4-straight bearish candles on the daily frame.
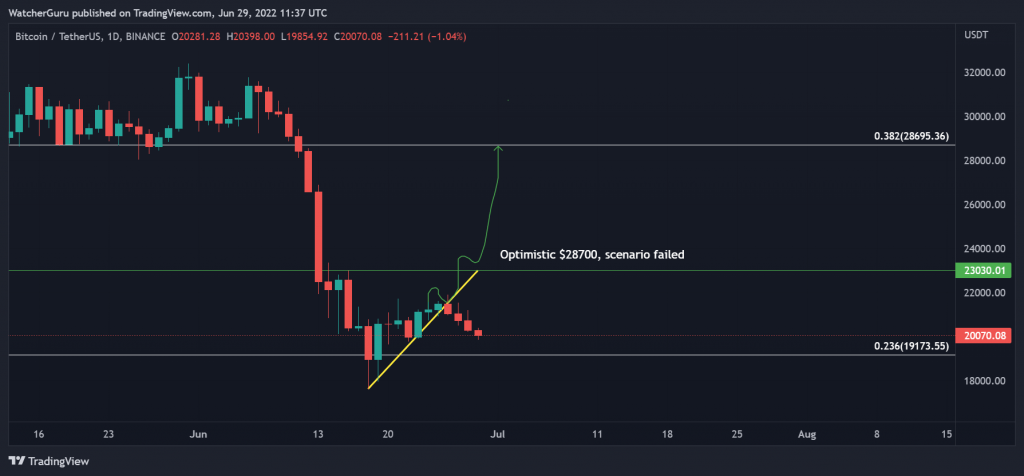
A moonshot situation at $28,700 has temporarily disappeared and a retest to $19,173 seems possible. While the market is expected to remain bearish in the coming days, an important signal suggested that Bitcoin bear market days could be counted in the future.
How long does it take for a Puell Multiple Rally?
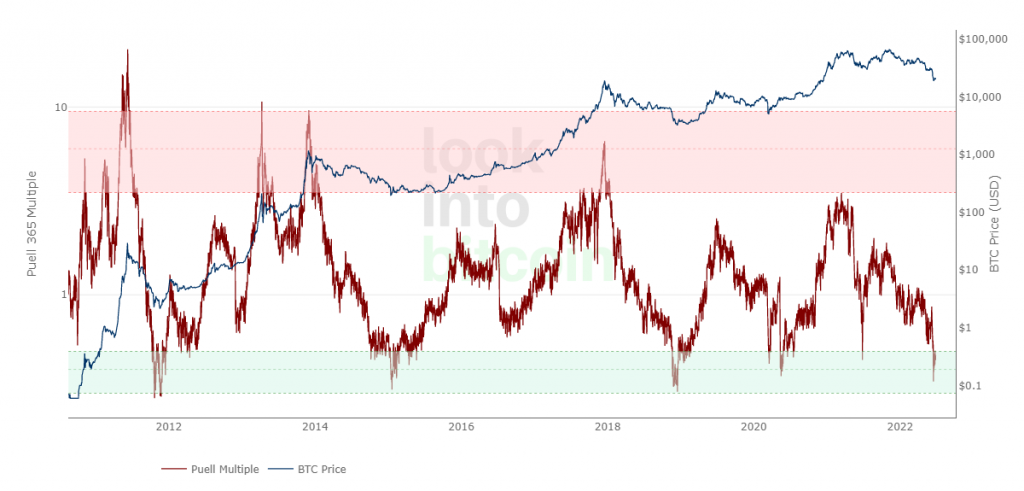
The Puell Multiple has historically been an important indicator to illustrate Bitcoin bottoms. The rate of change for the indicator is currently further optimized, and now there are three distinct regions of a market cycle. The red zones indicate the bull market’s euphoric highs, a mid-cycle rally is marked by center consolidation, and the green zones have marked the bottom for most bearish rallies. In 2022, the Puell Multiple has confirmed a bearish market and gradually the price could start to build up from this current position.
Analyzing the scenario, Bitcoin would be entering a market reversal period.
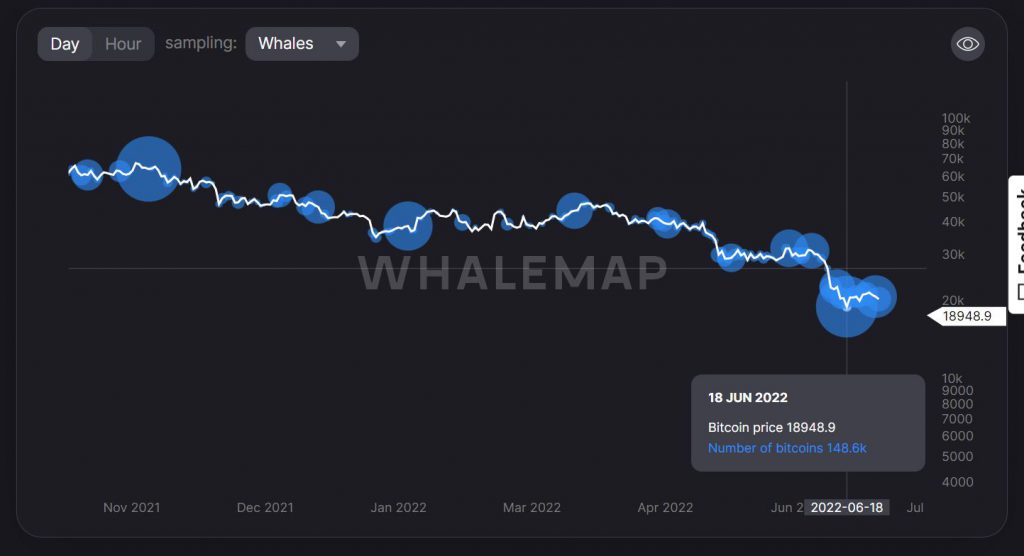
The movement of Bitcoin whales may assume a critical factor that bottom formation is underway. On November 12, 2021, 168.1k Bitcoins were collected. Seven months later, on June 18, another 148.1k Bitcoin was recorded as inflows for major wallets.
The conclusion that can be drawn from this is that Bitcoin could continue to bounce back from last week’s low of $19,173. This marks the start of recovery and Bitcoin could gradually move towards sustained price increases.
Is it that simple for Bitcoin?
Unfortunately not. As the first chart shows, the recovery period after a bearish cycle lasts for a longer period of time. The rising price slowly pushes the Puell indicator towards the middle of the cycle, and then the euphoric period moves valuation at an exponential rate. It is important to note that these are still assumptions taken from the measurements and are not yet confirmed trend periods.